
The latest #GroceryMarketShare figures from Kantar for the 12 weeks to 27 January 2019 show the sector remains in growth – up 1.7% compared to this time last year – boosted in part by the strong performance of fresh produce for Veganuary.
However, despite an overall sales increase year-on-year, total till roll sales fell £1.5 billion compared with the month of December. Replicating a common January trend, shoppers have again been keeping a watchful eye on grocery bills following last month’s record-breaking Christmas grocery spend.
Looking back on 2018 as a whole, one of the most notable consumer trends is the shift to a more plant-based diet. Today, 1% of all households include a vegan, 5% have a vegetarian and 10% have flexitarians in their ranks. This move has contributed to consumers eating a total of 4.4 billion meat-free dinners in 2018, an increase of 150 million meals on the year before.
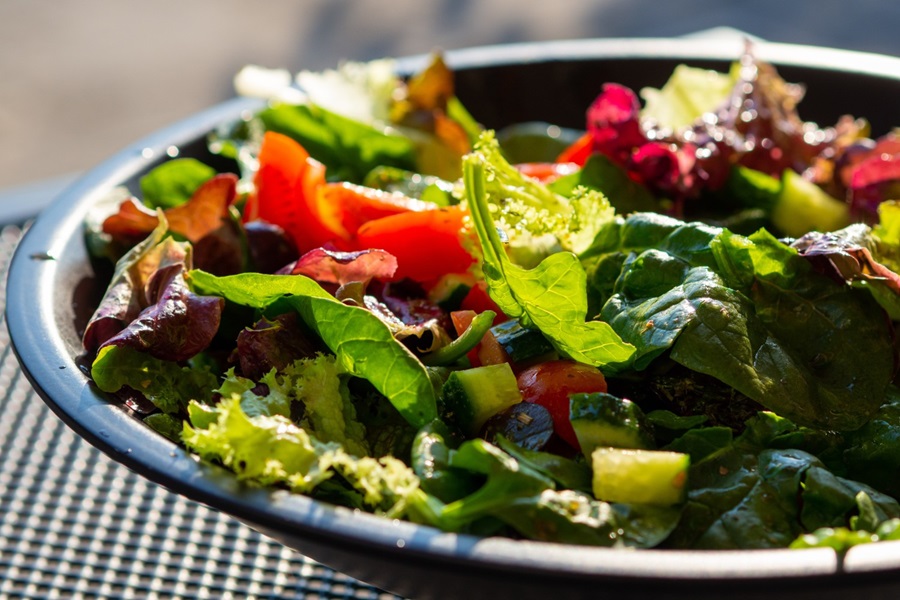
Following an indulgent Christmas period, health-conscious shoppers and Veganuary participants helped sales of fruit, vegetables and salad surge by £46 million compared with January last year. Cucumbers, carrots and berries in particular proved to be shopper favourites, rocketing by 26%, 22% and 13% respectively. Meanwhile, over two-thirds of customers bought an item labelled ‘free-from’* over the past month, with dairy alternatives like plant milks making up a quarter of total free-from sales.
Almost a third of consumers claim to be open to Dry January but this did not stop total alcohol sales from enjoying double-digit growth of 10% in the last 4 weeks. Alcohol performed well over the month, though this was helped by a strong New Year’s Eve, and when excluding sales on 31 December growth falls to 2.9%. All in all, 53% of households bought alcohol in January and while non and low-alcohol beers jumped by 79%, the popular #Ginuary helped gin sales grow by 23%.
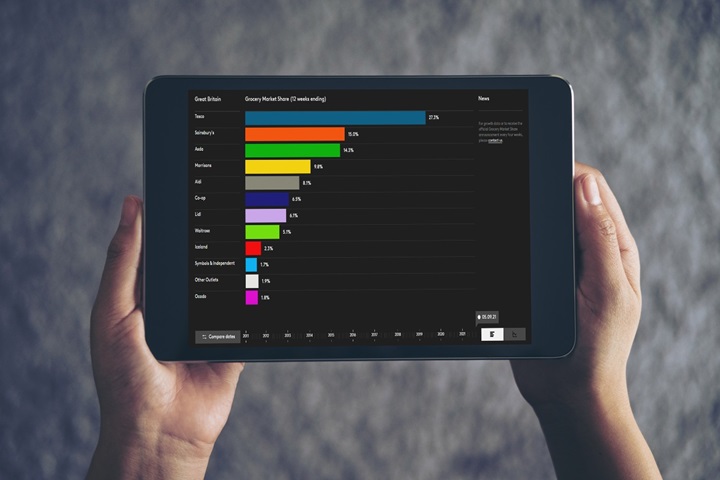
Aldi and Lidl have continued their strong run of form: 18.3 million households shopped in at least one of the discounters over the past 12 weeks, spending an average of £204 – up £8 compared with this time last year. With sales up 9.1%, Aldi was the fastest-growing supermarket, increasing its market share by 0.5 percentage points to 7.5%. Meanwhile, Lidl’s market share rose by 0.3 percentage points as sales growth clocked in at 7.3%.
With the exception of the discounters, Co-op was the only retailer to gain market share over this 12-week period. This now stands at 5.9% – up 0.1 percentage points on this time last year. An additional 346,000 consumers visited its stores, helping to buoy sales of its top-tier Irresistible range by 9%. The Co-op’s strongest growth was focused in the capital and, with more stores set to open this year in London and the south east, this trend is likely to continue.”
Tesco’s centenary commitment to ‘celebrate 100 years of great value’ has helped the grocer increase sales by 1.0% – its fastest rate of growth since September 2018. Its Exclusively at Tesco fresh food lines performed particularly strongly, with total sales reaching £130 million. Tesco’s market share now stands at 27.7% – down 0.2 percentage points on this time last year.
Despite sales at Morrisons rising by 0.4%, market share fell to 10.6% – down 0.2 percentage points. Morrisons’ recent announcement that it will hire 500 new apprentices for its counters could prove a savvy move: 41% of its customers already shop at the retailer’s Market Street stalls.
Asda’s double-digit online performance contributed to growth of 0.7%, though the retailer’s market share declined 0.2 percentage points to 15.3%. Meanwhile, Sainsbury’s saw sales fall by 0.3% while its market share dropped by 0.4 percentage points to 15.9%. Waitrose returned to growth this period with sales up 0.2% – the retailer’s market share dropped by 0.1 percentage points to 5.1%.
Iceland grew ahead of the market – up 2.3% – recording 11 successive periods of growth. Nearly half of the supermarket’s growth was channelled through its core frozen lines, with ambient groceries and alcohol also performing well. Ocado also held market share steady at 1.1% and saw sales rise by 1.0%.
*free-from labelled items refers to all products that are dairy-free or gluten-free
Notes for editors
Please note that four week ending or six week ending retailer share data should not be used in media reporting. The 12 week ending data stated in this release covers a longer time period which means it is a superior indicator of retailer performances and trends.
These findings are based on Kantar Worldpanel data for the 12 weeks to 27 January 2019. Kantar Worldpanel monitors the take home grocery purchasing habits of 30,000 demographically representative households across Great Britain. Kantar Worldpanel grocery market share data includes all expenditure through store tills, excluding petrol and in-store concessions. All data discussed in the above announcement is based on the value of items being bought by these consumers.
For all publicly-quoted data, users of our research (including media) must ensure that data is sourced to ‘Kantar Worldpanel’.
Retailer growth figures reported by Kantar Worldpanel relate to overall take home sales, and so include the impact of store openings or closures. Like-for-like sales change is not measured or reported. Calculating like-for-like sales requires a detailed knowledge of store openings and extensions which is information held accurately only by individual retailers.
Kantar Worldpanel will only support data that is published in the context we have presented it and our own interpretation of these findings. Our commentary is based upon our own data and information in the public domain. We cannot be held responsible for any other interpretation of these findings.
An update on inflation:
Grocery inflation now stands at +1.3%† for the 12 week period ending 27 January 2019. Prices have been rising since the 12 weeks to 1 January 2017, following a period of grocery price deflation which ran for 30 consecutive periods from September 2014 to December 2016. Prices are rising fastest in markets such as cola, toilet tissue and vitamins, while falling in instant coffee, fresh sausages and fresh bacon.
† This figure is based on over 75,000 identical products compared year-on-year in the proportions purchased by shoppers and therefore represents the most authoritative figure currently available. It is a ‘pure’ inflation measure in that shopping behaviour is held constant between the two comparison periods – shoppers are likely to achieve a lower personal inflation rate if they trade down or seek out more offers.