


Two streaming services with similar penetration levels enjoy different churn rates. Why is that? Amazon Prime Video has an effective brand activation (bundled-up free shipping), but their brand equity levels lag behind Netflix’s. How can Amazon Prime Video maintain their “unfair” activation advantage and reduce their churn rates?
C is for churn
Streaming might be having its moment in the spotlight, but its evil cousin ‘churn’ remains one of marketers’ greatest challenges. It’s churn that holds a platform back from maintaining its full subscriber/revenue potential, churn that surfaces ‘bundling together’ talks among rival streamers, and churn again that galvanises the idea of shifting from ad-free to ad-supported streaming.
Hunting for answers, we turned our attention to the Home and Video Entertainment category on Kantar’s latest brand tracking tool BrandDynamics, clicked a handful of drop-down arrows and voilà: charts and story presented themselves in front of our eyes.
Attitude surveys and online behaviour explain and predict future sales
The eureka moment for this US streaming video-on-demand market case study comes from combining brand equity (attitudinal data) and point of sale (behavioural data). This unique blend of observation and discussion make the picture complete, as they both weigh into the answer.*
Let’s dive in. Penetration, churn and Demand Power are pawns in a game of streaming chess, but what are the correlations among them?
- Overall, penetration and churn are inversely correlated: the higher number of subscribers, the lower the churn. (Figure 1)
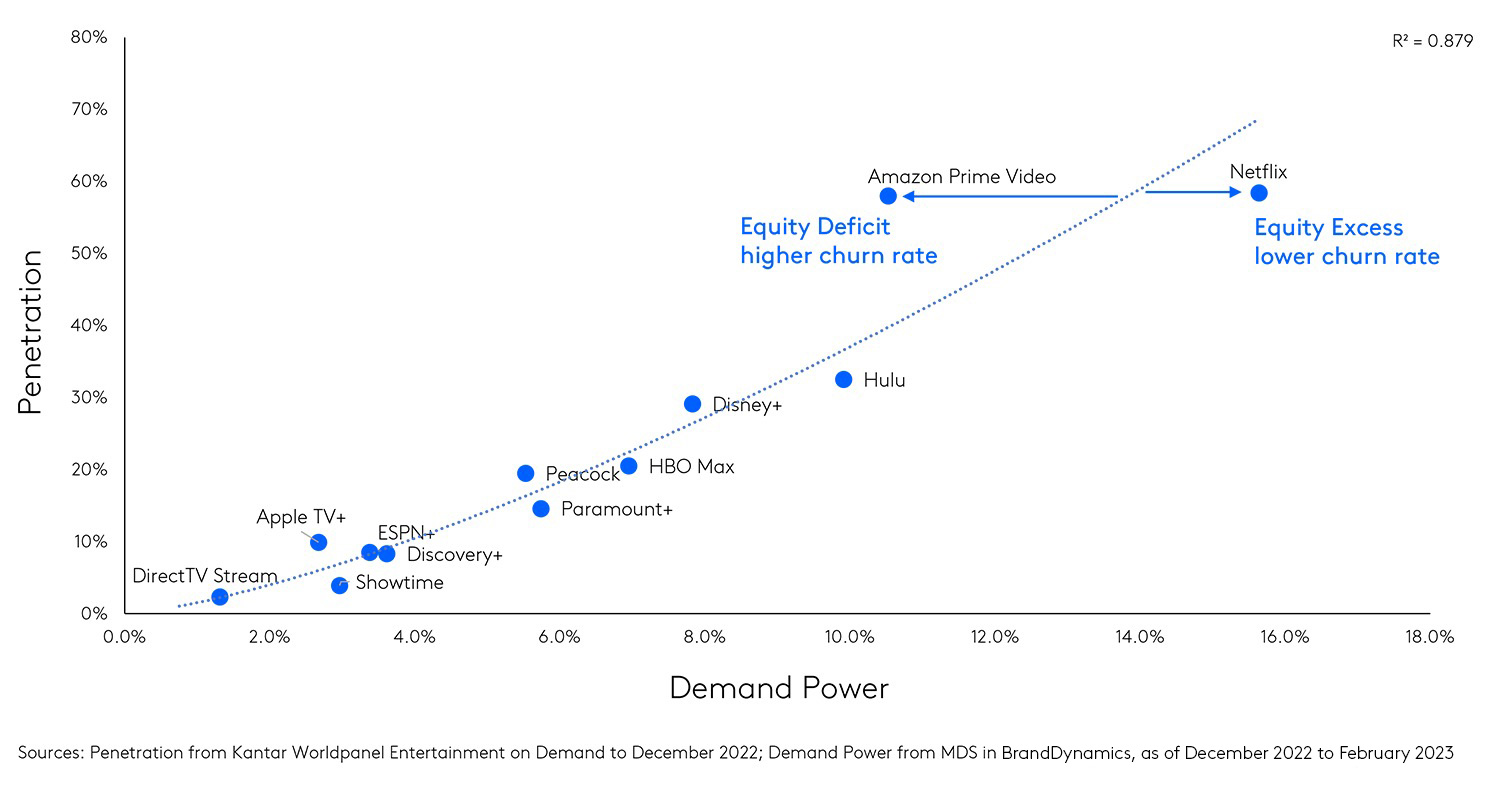
- Demand Power (a brand equity metric) and penetration are positively associated; the larger the equity, the greater the penetration. (Figure 2)
Figure 1. Penetration and churn are inversely correlated
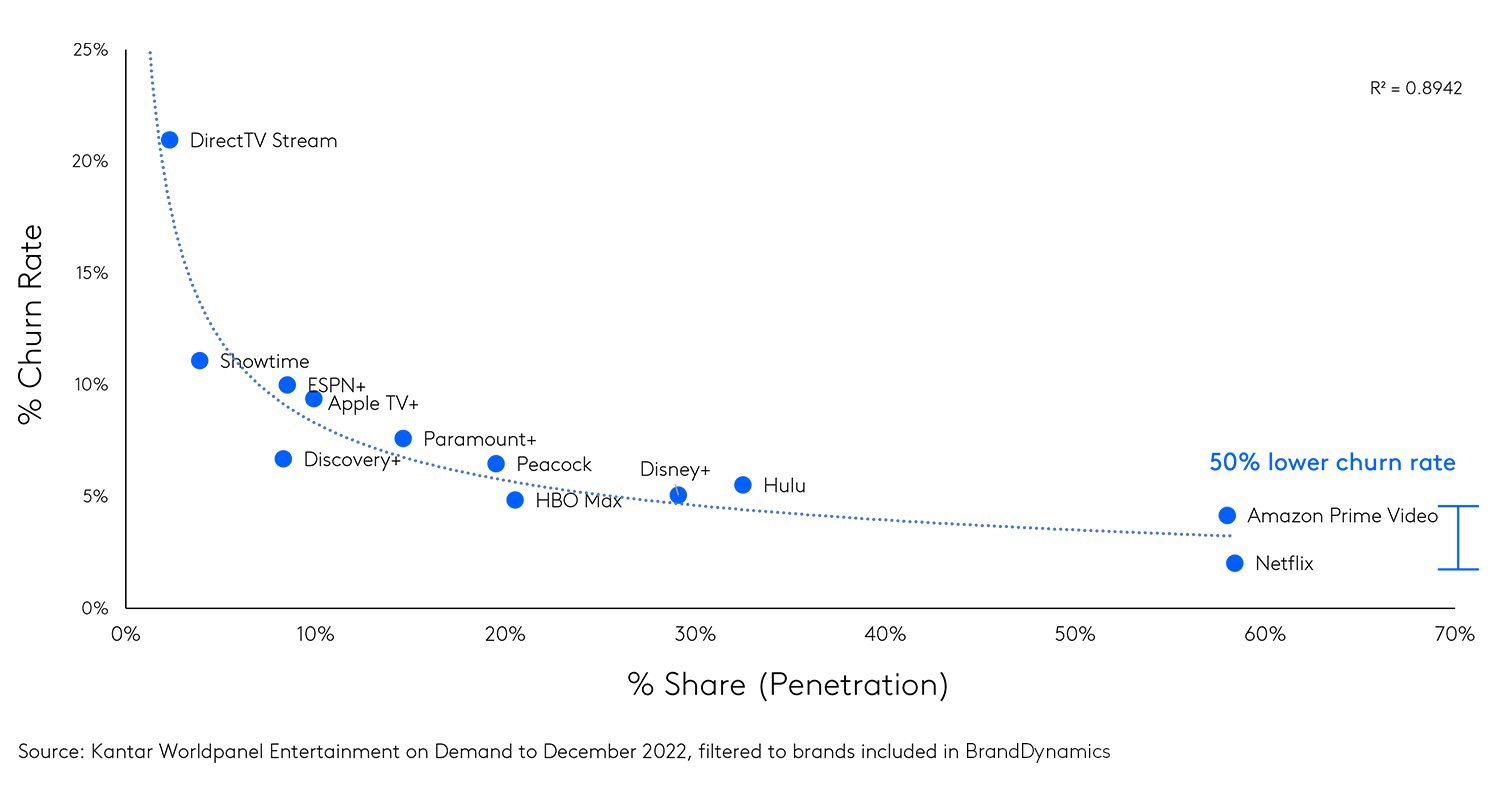
Figure 2. Demand Power and Penetration are positively associated
Even salt looks like sugar. So, look closer: what drives penetration?
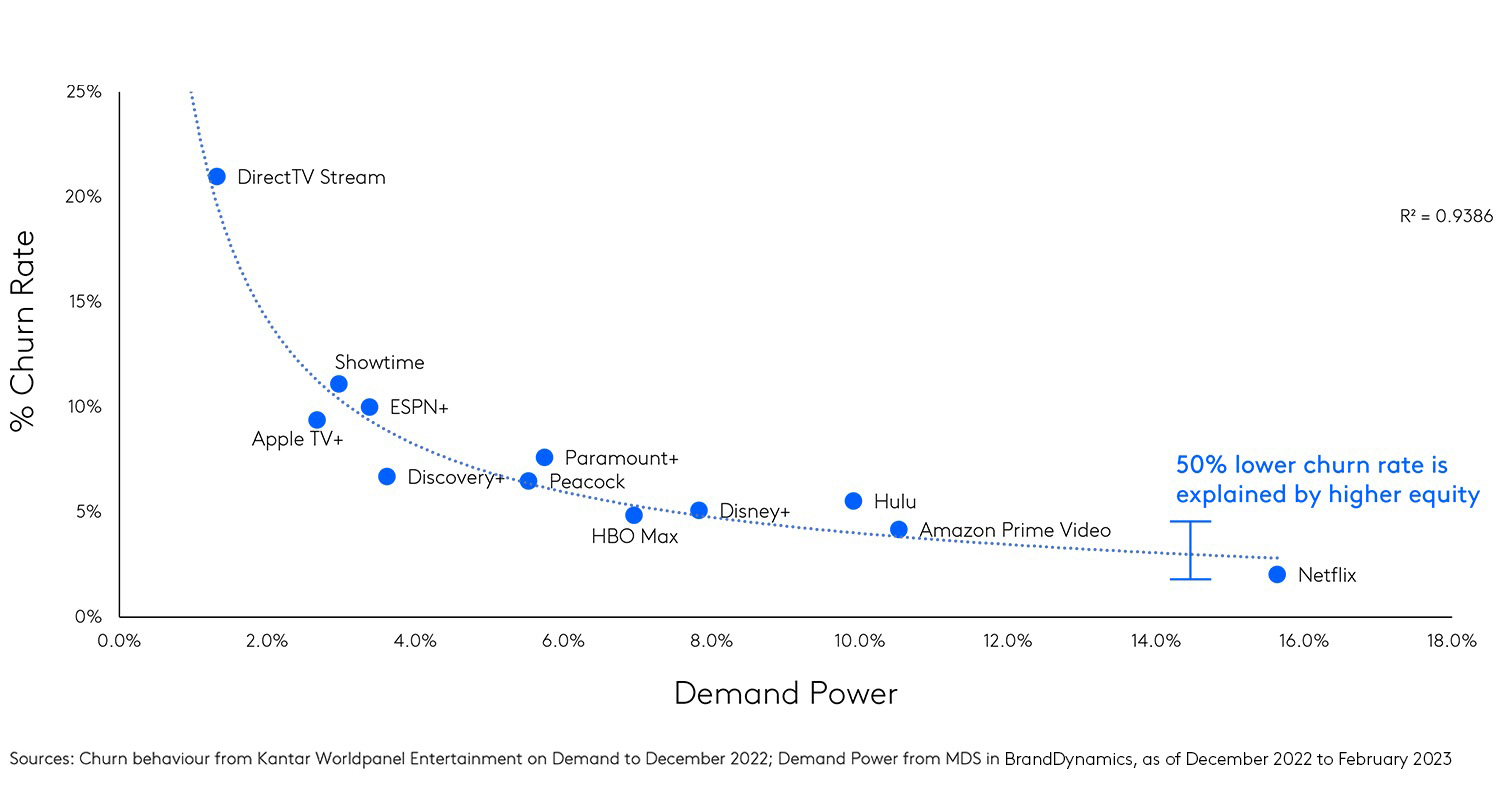
Given that Netflix and Amazon Prime Video have comparable penetration levels, one would expect their churn rates to be similar as well, but this is not the case. Amazon Prime Video’s subscriber base leaks more excessively. What’s causing this?
Our sensitive brand equity measures on BrandDynamics pinpointed the answer. Amazon Prime Video’s unconventional brand activation bears penetration fruits: free trials and original content lure people to sign up. However, it’s the household membership to Amazon Prime that offers the most organic access to Prime Video. If you get complimentary shipping, you naturally qualify to watch hundreds of TV shows and movies from Amazon Prime Video on any of your devices. Happy days for the viewers who make the most of their Amazon Prime membership and get busy browsing through the platform’s content. The only caveat is that these new viewers drop off as soon as the complimentary shipping disappears. Why is that? Amazon Prime Video has weaker equity than Netflix’s, so they fail to maintain their penetration levels for the long term (post the free delivery benefits). Netflix, on the other hand, enjoys higher equity and a 50% lower churn rate. (Figure 3)
Figure 3. Demand Power explains the differences in churn rate
It’s clear that Amazon Prime Video have been using their activation advantage to facilitate current sales. In order to influence consumers’ ongoing preferences though, they’ve got to turn their activation advantage into a more sustainable penetration tool. Or in other words: if Amazon Prime Video wants to accelerate their growth trajectory, it’s time to take their brand equity up a notch.
Consumers don’t choose randomly between what’s available. A brand’s equity plays a crucial role in consumers’ decision to choose it now, in the future and often again. Brand equity is one of your business’s most valuable assets; it unlocks penetration that hasn’t happened yet and converts existing penetration into longer-term preference.
But although there is undeniable evidence that the stronger the brand, the greater the shareholder returns and the higher the contribution to a business’s cash flow, many brand managers fail to track their brand’s equity, what is in people’s minds about their brands.
The latest brand tracking technology leaves no room for excuses. At Kantar, we use the power of AI to wield daily benchmarks and short-term forecasts for 25 product and service categories that can help you steer your brand performance. This amalgam of indicators can help you make better and faster decisions about becoming consumers’ preferred choice and how to grow your brand. Find out more about BrandDynamics on Kantar Marketplace.
*BrandDynamics analyses attitudinal data and explicit survey responses from consumers. Any implicit behavioural data is currently blended manually on request and will be fully integrated into BrandDynamics in 2024.
