
As COVID-19 restrictions continue to ease and more consumers are out and about, smartphone purchasing is reverting to in-store in the US and across most of Europe’s big five markets (the exception being Germany), with each market showing in-store channel share growth, up by at least 10% points year on year. However, for APAC markets (China, Japan, and Australia), in-store purchasing versus online remains almost flat year on year, as revealed by our smartphone OS data for the second quarter of 2021.
In Q2 2021, year-on-year OS performance shares remain relatively stable across the EU5 (Great Britain, Germany, France, Italy and Spain) and Australia. In the US and China, iOS performance is up 2 percentage points each year on year, and in Japan Android sales share is up 5 percentage points driven by strong performance from Sharp (+5 percentage points year on year) and Oppo (+3 percentage points year on year).
Despite little sales share movement at an OS level across most reported markets, individual brand performance for Oppo and Samsung in the EU5 shows +3% and +5% year-on-year growth, respectively. Samsung sales share also grows by 4 percentage points in Australia and the US, taking over 30% of sales in Q2 2021 although still behind iPhone sales.
Buying a new phone to make the most of 5G
The appeal of 5G continues to grow in Q2 2021. As a feature driver of purchasing, ‘5G capability’ citation is in double digit share points growth year on year, in nearly all reported markets: the US (+19 percentage points year on year), the EU5 (+11 percentage points year on year), Japan (+10 percentage points year on year), Australia (+9 percentage points year on year). While ‘5G capability’ is as a reason for purchasing is near flat in China year on year, 1 in 5 smartphone buyers are citing this as a driver. Of the top 10 models sold in China, 70% are 5G enabled. In Japan this is 60%; it’s 50% in both US and Australia, and 40% across the EU5.
Across reported markets, except in Japan, among those intending to purchase a new smartphone in the next six months, over two thirds have hopes of buying a 5G enabled phone; the highest proportion being in China at 91%. Although Japan has the lowest reported proportion, it still sits at 55% of future buyers. Zooming in on the US specifically, among the 74% of future 5G-connected smartphone hopefuls, 26% are connected to Verizon network provider, 26% T-Mobile/Sprint combined, and 23% AT&T. Among future buyers who have no interest in 5G connectivity, Verizon and T-Mobile/Sprint currently service 21%, 14% are subscribed to AT&T, and 10% to TracFone Wireless.
Purchasing smartphones in a store or online?
In Q2 2021, in the US and in all EU5 markets (except Germany), channel shares for in-store sales increased by at least 10 percentage points year on year in each local country. In-store sales shares are also up this quarter compared to Q1 2021 in Great Britain (+13 percentage points), US (+7 percentage points), Germany (+4 percentage points), and Spain (+3 percentage points). As COVID-19 vaccinations continue to roll-out, and businesses open with reduced restrictions, more consumers are high-street shopping.
In the US, smartphone owners who self-purchased their phone in-store are those who are more likely to agree to “I keep my smartphone for as long as I can” (80% vs. 77% online buyers). This also holds true in Australia, Japan and the EU5. When it comes to mobile technology more generally, in-store smartphone buyers in US, Australia, and Japan are more likely to agree that they “Prefer to buy brands that I am familiar with” and, in these local markets plus the EU5, smartphone buyers in-store are also more likely to agree with “If I am going to be able to use a new technology product, somebody has to show me how to use it” (9% vs. 13% online buyers).
As governments deliver announcements of new COVID-19 variants, it is important to monitor channel sales to better inform marketing activation decisions.
Smartphone OS Sales Share (%)
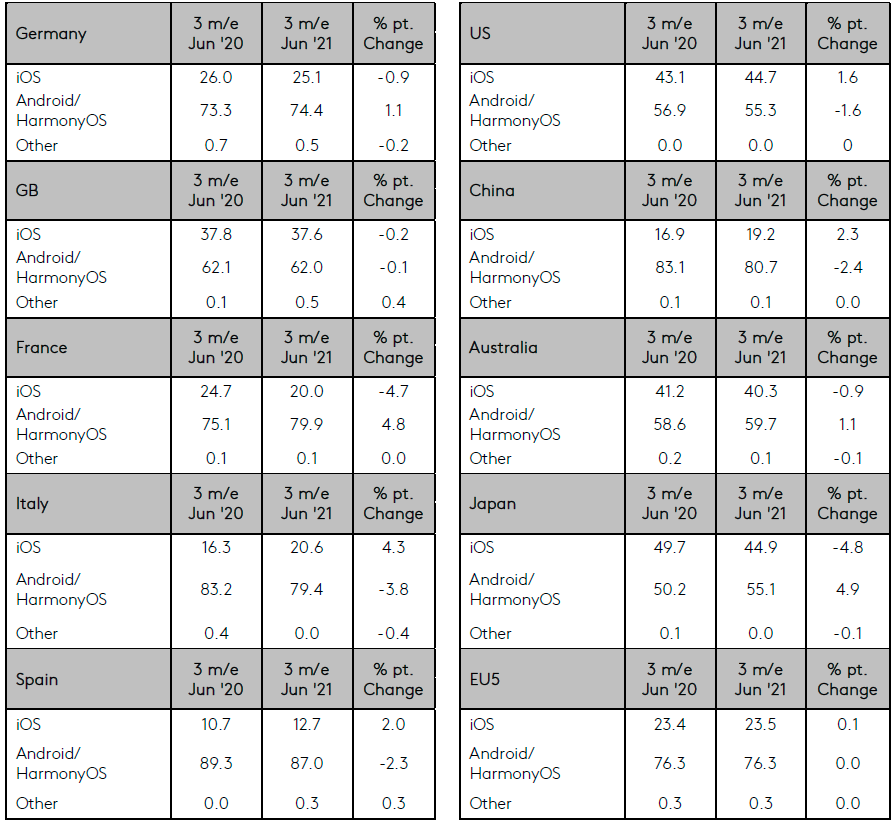
Source: Worldpanel ComTech, Kantar
Please note that HarmonyOS can be separated from Android; please contact Kantar as necessary.
Kantar’s data visualisation tool allows you to view and analyse smartphone OS market share data online. The latest sales share figures for the major operators can be viewed and compared with historical figures here.