

In Q2 2021, 1.4 million Australian households signed up to at least one new video subscription service, which is almost 14% of households. Netflix accounts for almost 22% of new subscriptions, although Amazon Prime Video is not far behind with a 17% share. Disney+ is in third place at 12%. Stan and Stan Sport collectively account for 8.5% of new subscriptions in the three-month period, whilst Foxtel’s three brands (Binge, Foxtel Now and Kayo) total 12.2%.
The results come from Kantar’s new Entertainment on Demand pilot study for Australia, which reports new music and video subscriptions taken out in the three months to June 2021. Entertainment on Demand (EoD) is already a well-established service in the US and the UK, and client demand has driven its recent expansion into Germany and now Australia. The service tracks the full digital subscription customer journey across music and video.
Profile of the Aussie subscriber
Almost a third of the new online video subscriptions are “Gateway Subscribers”, those who are completely new to the category. Netflix is generally the gateway subscription, with friends/family being an important source of information prior to signup.
“Stacked Subscribers”, those adding this new service to their existing subscriptions, account for 42% of the subscribers – over half of Binge subscriptions are stacked, and almost half for Stan. The offer of a free trial is the top marketing touchpoint for both service providers.
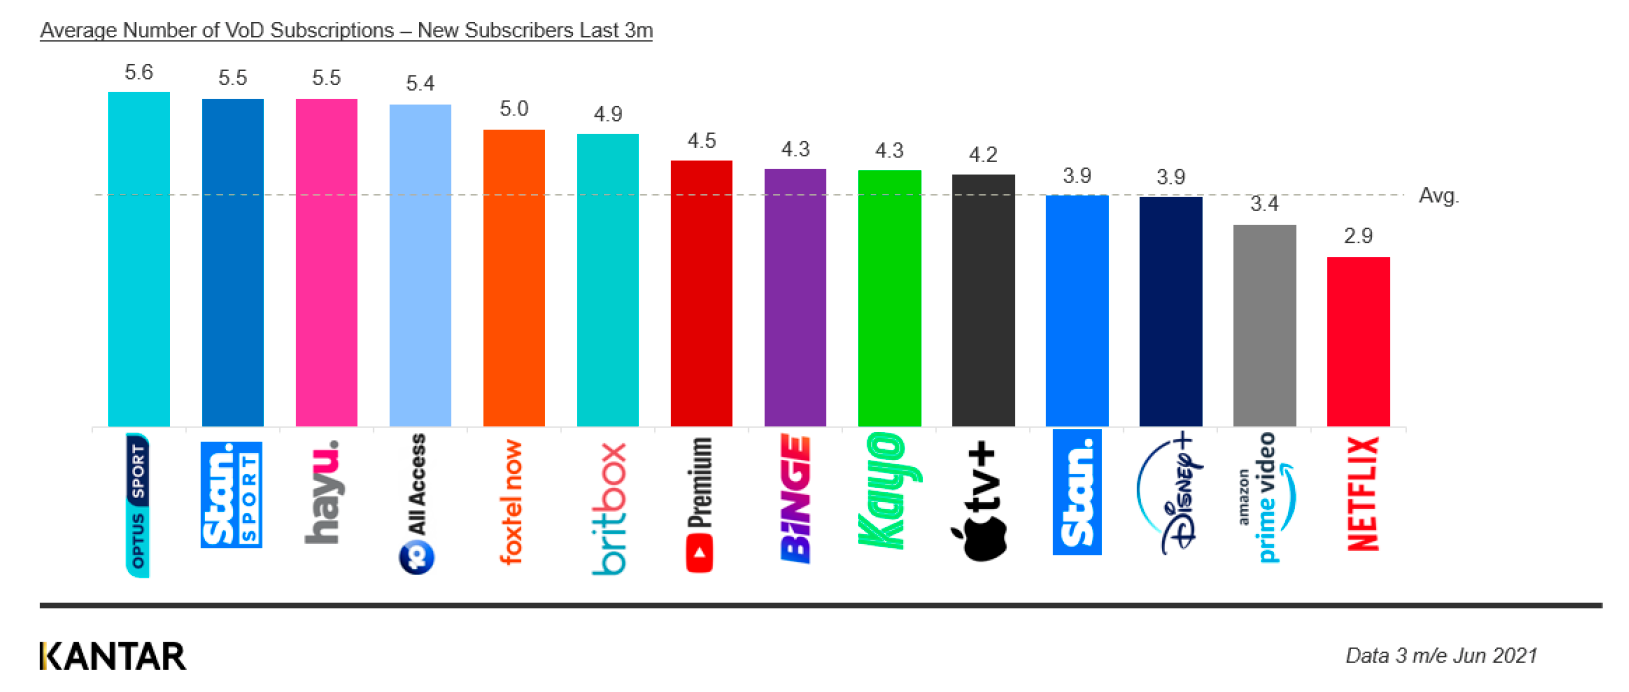
The average number of video on demand (VoD) subscriptions held is 3.9, with only Netflix, Amazon Prime Video, Disney+ and Stan users holding that number or fewer.
Consumers taking out a new subscription on average already hold 3.9 accounts
Among new VoD subscribers, 18% cancelled an existing digital streaming subscription in order to take out a new one – rising to 25% and 21% among Binge and Britbox subscribers, respectively.
Being able to ‘watch content when I want’ is the top driver for first-time streamers, with 30% of households citing this as the reason for taking out a subscription. However, buying a smart TV to allow easy access to digital content is a trigger for one quarter of first-time streamers, while 11% took out a VoD subscription to replace their cable TV service – this is particularly apparent when looking at those who signed up to a Britbox service.
What is driving customer satisfaction?
Consumers love Netflix and YouTube Premium, which was reflected in their high net promoter scores (NPS) of 49 and 44 respectively, outperforming the market average of 30 points. Ease of use, the amount of original content, and “value for money” are the biggest drivers of satisfaction for Netflix subscribers.
For YouTube Premium, the ability to download content (rather than “value for money”) was important, since YouTube Premium customers are nearly twice as likely to watch content whilst commuting or on the go compared to the average VoD subscriber.
Disney+ NPS is just above average at 31 points, where content is driving high satisfaction, including the variety of TV series or classic films, the quality of the shows, or the number of new release films. Two titles among the top 10 most recommended by friends and family are from Disney+, namely Loki and Black Widow, whilst The Mandalorian makes it into the top 10 of content most enjoyed. In contrast, NPS ratings for Amazon Prime Video and Stan among new subscribers are below average at 23 and 20 points respectively.
Analysis of NPS diagnostics in other markets operating the Entertainment on Demand service often shows that the score increases around three months after subscribing, once consumers have learned how to navigate the content. This may well be the case with new Amazon customers, where there are potentially issues relating to the TV interface and ease of use (in finding TV content) with satisfaction on value for money also below average.
For Stan customers, “value for money” and the amount or variety of content available are the factors driving satisfaction, and customers like the ability to watch content on several different devices/screens. However, the quality of the shows and the quality of the recommendations of what to watch next appear to be driving some unhappiness and this is reflected in customers giving a below-average score after having the service for a long time. Britbox earn the highest score on this factor, at 8.3/10.
Spotify leads the surge in music subscriptions
Over 1.1 million households added a new music subscription service in the three months to June 2021 – more than 10% of households, which is not far behind the number of new video subscriptions. Spotify leads, accounting for 26% of new subscriptions, although around half are using a free version and a further 7% are on a free trial. One in five chose an Amazon Music Unlimited (AMU) service, with over 60% paying for it. Apple is some way behind with a share of 13.6%, although it manages to secure around one quarter of new subscribers on a yearly subscription, reducing the immediate risk of churn.
What is driving new music subscriptions?
Over half a million – 580,000 – of the new music subscriptions are Gateway Subscribers coming into the category for the first time. Spotify is generally the gateway subscription, with 53% of its new subscriber base being completely new to the category. The offer of a free trial, and word of mouth via friends/family, are the key marketing touchpoints prior to signup with Spotify.
Stacked Subscribers, adding this new service to their existing subscriptions, account for 570,000 signups. Over half of AMU new subscriptions are stacked, with this group generally researching more than average prior to sign-up. Advertising (which has seen heavy investment) as well as online reviews are the key touchpoints for this group. 9% of new subscribers cancelled an existing digital streaming subscription in order to take out a new one. This rises to 11% and 13% among YouTube and SoundCloud services respectively.
“Free trials” were cited as a key trigger by 22% of those adding to their existing services, whilst acquisition of a wireless speaker is a trigger for 14% of first-time streamers. Access to a wider variety of music is the top trigger for new Spotify subscribers.
“Value for money” and the variety of podcasts available are relatively more important purchase drivers among those signing up with AMU, whilst for Spotify customers, it is more about the variety of artists and new releases available, streaming sound quality and, importantly, it being the music platform that their friends use.
Spotify top for customer satisfaction
Spotify customers love their service the most, reflected in a high net promoter score (NPS) of 38 points, against a market average of 25. Key drivers of satisfaction with Spotify subscribers are artists available, sound quality, and the smartphone interface.
NPS for AMU is lower than average at 20 points – whilst delivering on the value for money that customers signed up for, advocacy is generally being dragged down by the smartphone interface, the inability for subscribers to follow or interact with friends, and a poor onboarding experience relative to other platforms.
Spotify and YouTube Music customers tend to show an interest in a wider variety of music genres compared to Apple Music and AMU customers, with Rock especially lower among the latter two. For the more niche High Fidelity streaming providers such as Tidal or QoBuz, interest is relatively higher for genres such as Classical, Country, or Jazz/Blues music. Coming soon
Entertainment on Demand will be rolled out fully next year in Australia across a longitudinal panel of 10,000 consumers. It will continuously track Australian customers’ experience and engagement with their various subscription services and measure acquisition, loyalty and churn, as well as planned take-up or cancellation of a service and the reasons behind that.
Reach out to our experts if you would like to learn more.