
When looking at combined sales for both out-of-home (OOH) and in-home for the snacking and non-alcoholic beverages sectors, the overall picture is negative. OOH sales were down $22 billion (-26%), whilst in-home sales were up $8 billion (+8%) from the markets included in our analysis. In eight out of nine markets, OOH sales declined, which led to combined in-and-out sales being down in Spain, Great Britain, China, Thailand, France and Brazil.
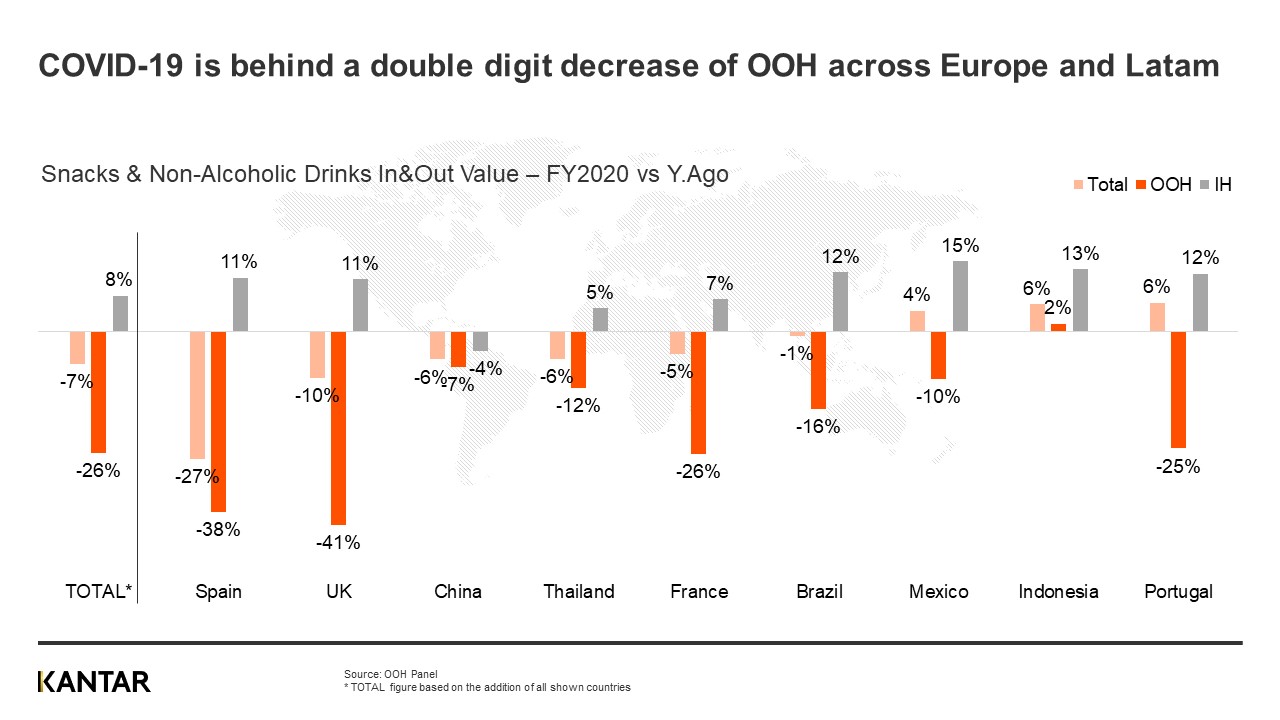
Mexico and Portugal are markets where in-home sales compensated for a double-digit fall in OOH sales, whilst Indonesia was the only market where OOH sales remained in growth. There are a couple of reasons behind this. In Mexico and Indonesia, snacking accounts for more OOH spend than beverages, and it was the latter that drove the overall decline globally. In Portugal, OOH accounts for the lowest proportion of combined in-and-out spend, less than 20%.
As a result of this decline, OOH share of sales has fallen from 44% in 2019 to 35% in 2020. This fall in share is seen everywhere except for China, and the most significant falls happened where the disparity between OOH and in-home sales is most remarkable, in the UK and Spain, which both saw the importance of OOH sales fall by 14 percentage points.
Beverages driving the OOH decline
With non-alcoholic beverages accounting for 64% of OOH sales before 2020, this sector’s performance always has the most significant impact on the OOH picture. By the end of 2020, OOH beverages sales had declined over 30%, whilst in-home sales only increased by 6%, meaning total sales fell 14%. OOH snacking, on the other hand, also suffered a double-digit decline in sales (of 18%), but with in-home sales increasing over 8% and making up two-thirds of sales (before 2020), this growth was enough to see snacking remain flat in 2020.
Beverages were hit hardest during the first lockdown period (Q2 2020), with OOH sales more than halving in these three months. While neither sector bounced back fully in any quarter in 2020, the recovery was better for snacking in Q3, and at the same time, in-home sales accelerated to double-digit growth in both Q2 and Q4.
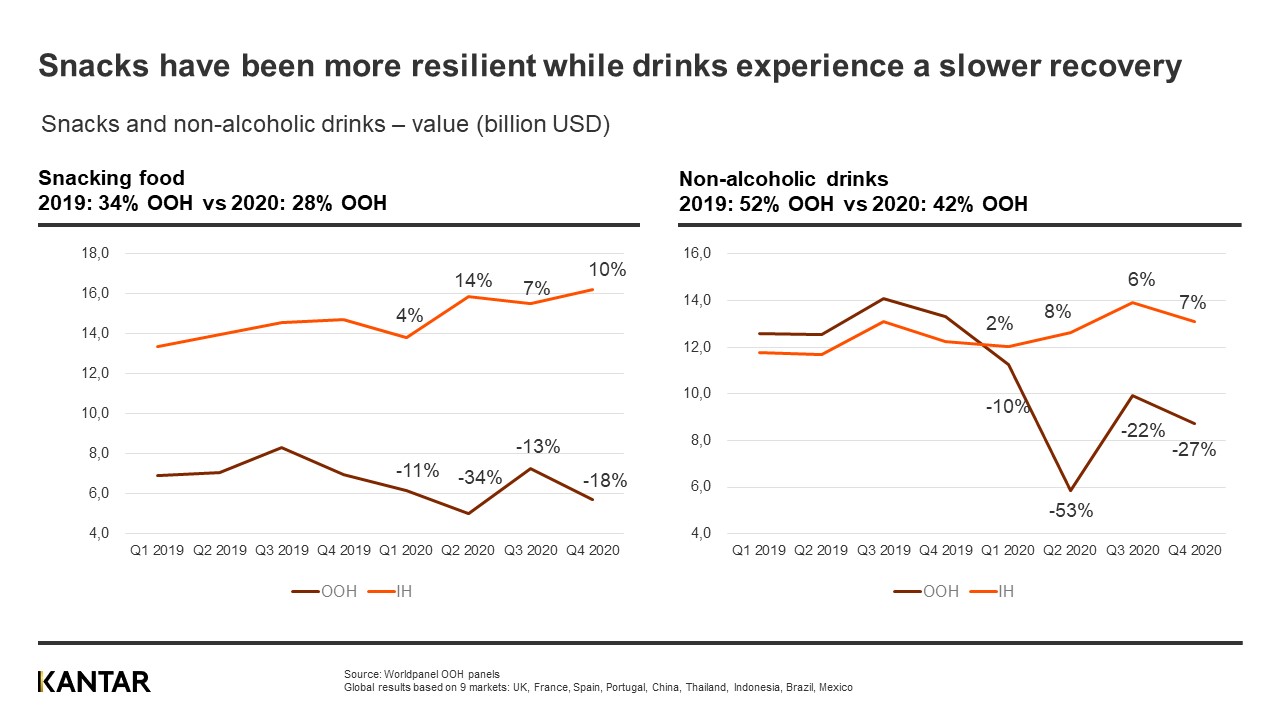
Looking at specific categories within beverages, carbonated soft drinks and coffee (which had the highest reliance on OOH) suffered the most significant in-and-out decline at -16% and -22%. At the opposite end, within snacking, we have chocolate and salty snacks, the two categories with the lowest reliance on OOH for overall sales, both remaining in growth at 4% and 5%, respectively.
Alongside the reliance on OOH sales, even if all OOH occasions switched to in-home, the beverages sector is always going to suffer more due to prices. The cost of the average beverage occasion is 1.20€ OOH vs 0.20€ in-home, meaning that a shopper needs to enjoy a drink six times in their home to contribute as much in value terms as buying one drink outside their home.
Hotel, restaurant and cafe sales down $15 billion
When we consider OOH sales, we have four distinct channels: two of which are pure OOH – horeca (hotels, restaurants and cafes) and “impulse” (vending machines, street vendors, gas stations), and two which play in-and-out of the home – modern trade and traditional trade.
In terms of spend, 60% of OOH comes from the pure OOH channels (41% for horeca and 19% for impulse), and these two were understandably hardest hit by COVID-19 given the lockdown restrictions across countries over the course of 2020. Sales were down 36% in horeca and 24% in impulse, meaning their decline was behind 85% of the $22 billion loss in OOH sales, with horeca accounting for most of this.
Although the channel landscape is unique by country, the impact and decline of horeca meant the channel lost share almost everywhere and dropped to 41% in 2020, down from 48% in 2019. France was the only country where the OOH decline was worse for impulse and traditional.
The channel is particularly relevant in Europe, representing over 50% of OOH spend in all four markets. Outside of Europe, modern trade is the most crucial channel in Thailand, China and Mexico, whilst in Brazil, it is impulse and for Indonesia traditional trade.
Modern trade was the channel that saw the biggest gain in share in 2020, increasing share to 58% (from 53% in 2019) when looking at total in-and-out spend, and now accounting for over one quarter of OOH sales.
This shift to modern trade provides manufacturers with a further opportunity to win the OOH occasion, particularly in Europe. Within the modern trade channel, OOH accounts for 16% of snacking and beverages spend across markets, whilst in Mexico, Thailand, Indonesia, and China, that level is 40% and higher. In Europe, the share of OOH remains below 10% despite the shift to the channel caused by COVID-19.
Out-of-Home will return
The impact of COVID-19 on OOH sales was perhaps apparent and expected, but now more than ever, OOH data is essential to understand the complete 360° picture for your brand and category. As lockdowns ease, OOH sales will return, but the question remains: how quickly? We will be updating the trends seen here every quarter, and if you want to understand more about the specifics behind the data, do get in touch to discuss how we can analyse specific countries, categories, channels and brands.
Editor’s Note:
All the findings are based on the full calendar year 2020 vs 2019 using our Out-of-Home purchase panels across nine markets: Brazil, China, France, GB, Indonesia, Mexico, Portugal, Spain and Thailand.
These panels provide us with a global continuous sample and with the latest technology available, we record every snack, beverage and meal bought for consumption out-of-home, whether that’s on the go, at the place of purchase, in the workplace or elsewhere.
In these findings we cover two sectors: snacking (chocolate, biscuits/cakes/cakes, salty snacks, ice-cream) and non-alcoholic beverages (coffee, carbonated soft drinks, juice, packaged water).
We also cover four distinct channels: horeca (pubs, bars, restaurants – QSR and FSR, chains and independents – coffee shops, bakeries, sandwich shops), impulse (kiosks, candy stores, petrol stations, mobile car, food truck, street vendors, vending machines), modern trade (hypermarkets, supermarkets and convenience stores, self-served) and traditional trade (traditional food stores, not self-served).
Download the full deck to find out more.